Most systems show orders, stock or reports separately. RestoVector links each operational event to the cost and performance figures it creates.
01Waiter orders→
02Kitchen prepares→
03Service serves→
04Payment closes→
05Inventory deducts→
06Analytics updates
Restaurant cost control software for independent restaurants.
The owner can trace a margin change back to the dishes, ingredients, waste, purchases and supplier prices that caused it—not just see a final percentage.
THE PLATFORM
Clarity changes decisions.
These are real RestoVector screens using example restaurant data. The interface adapts to each role, device, theme and location.
01 / 03
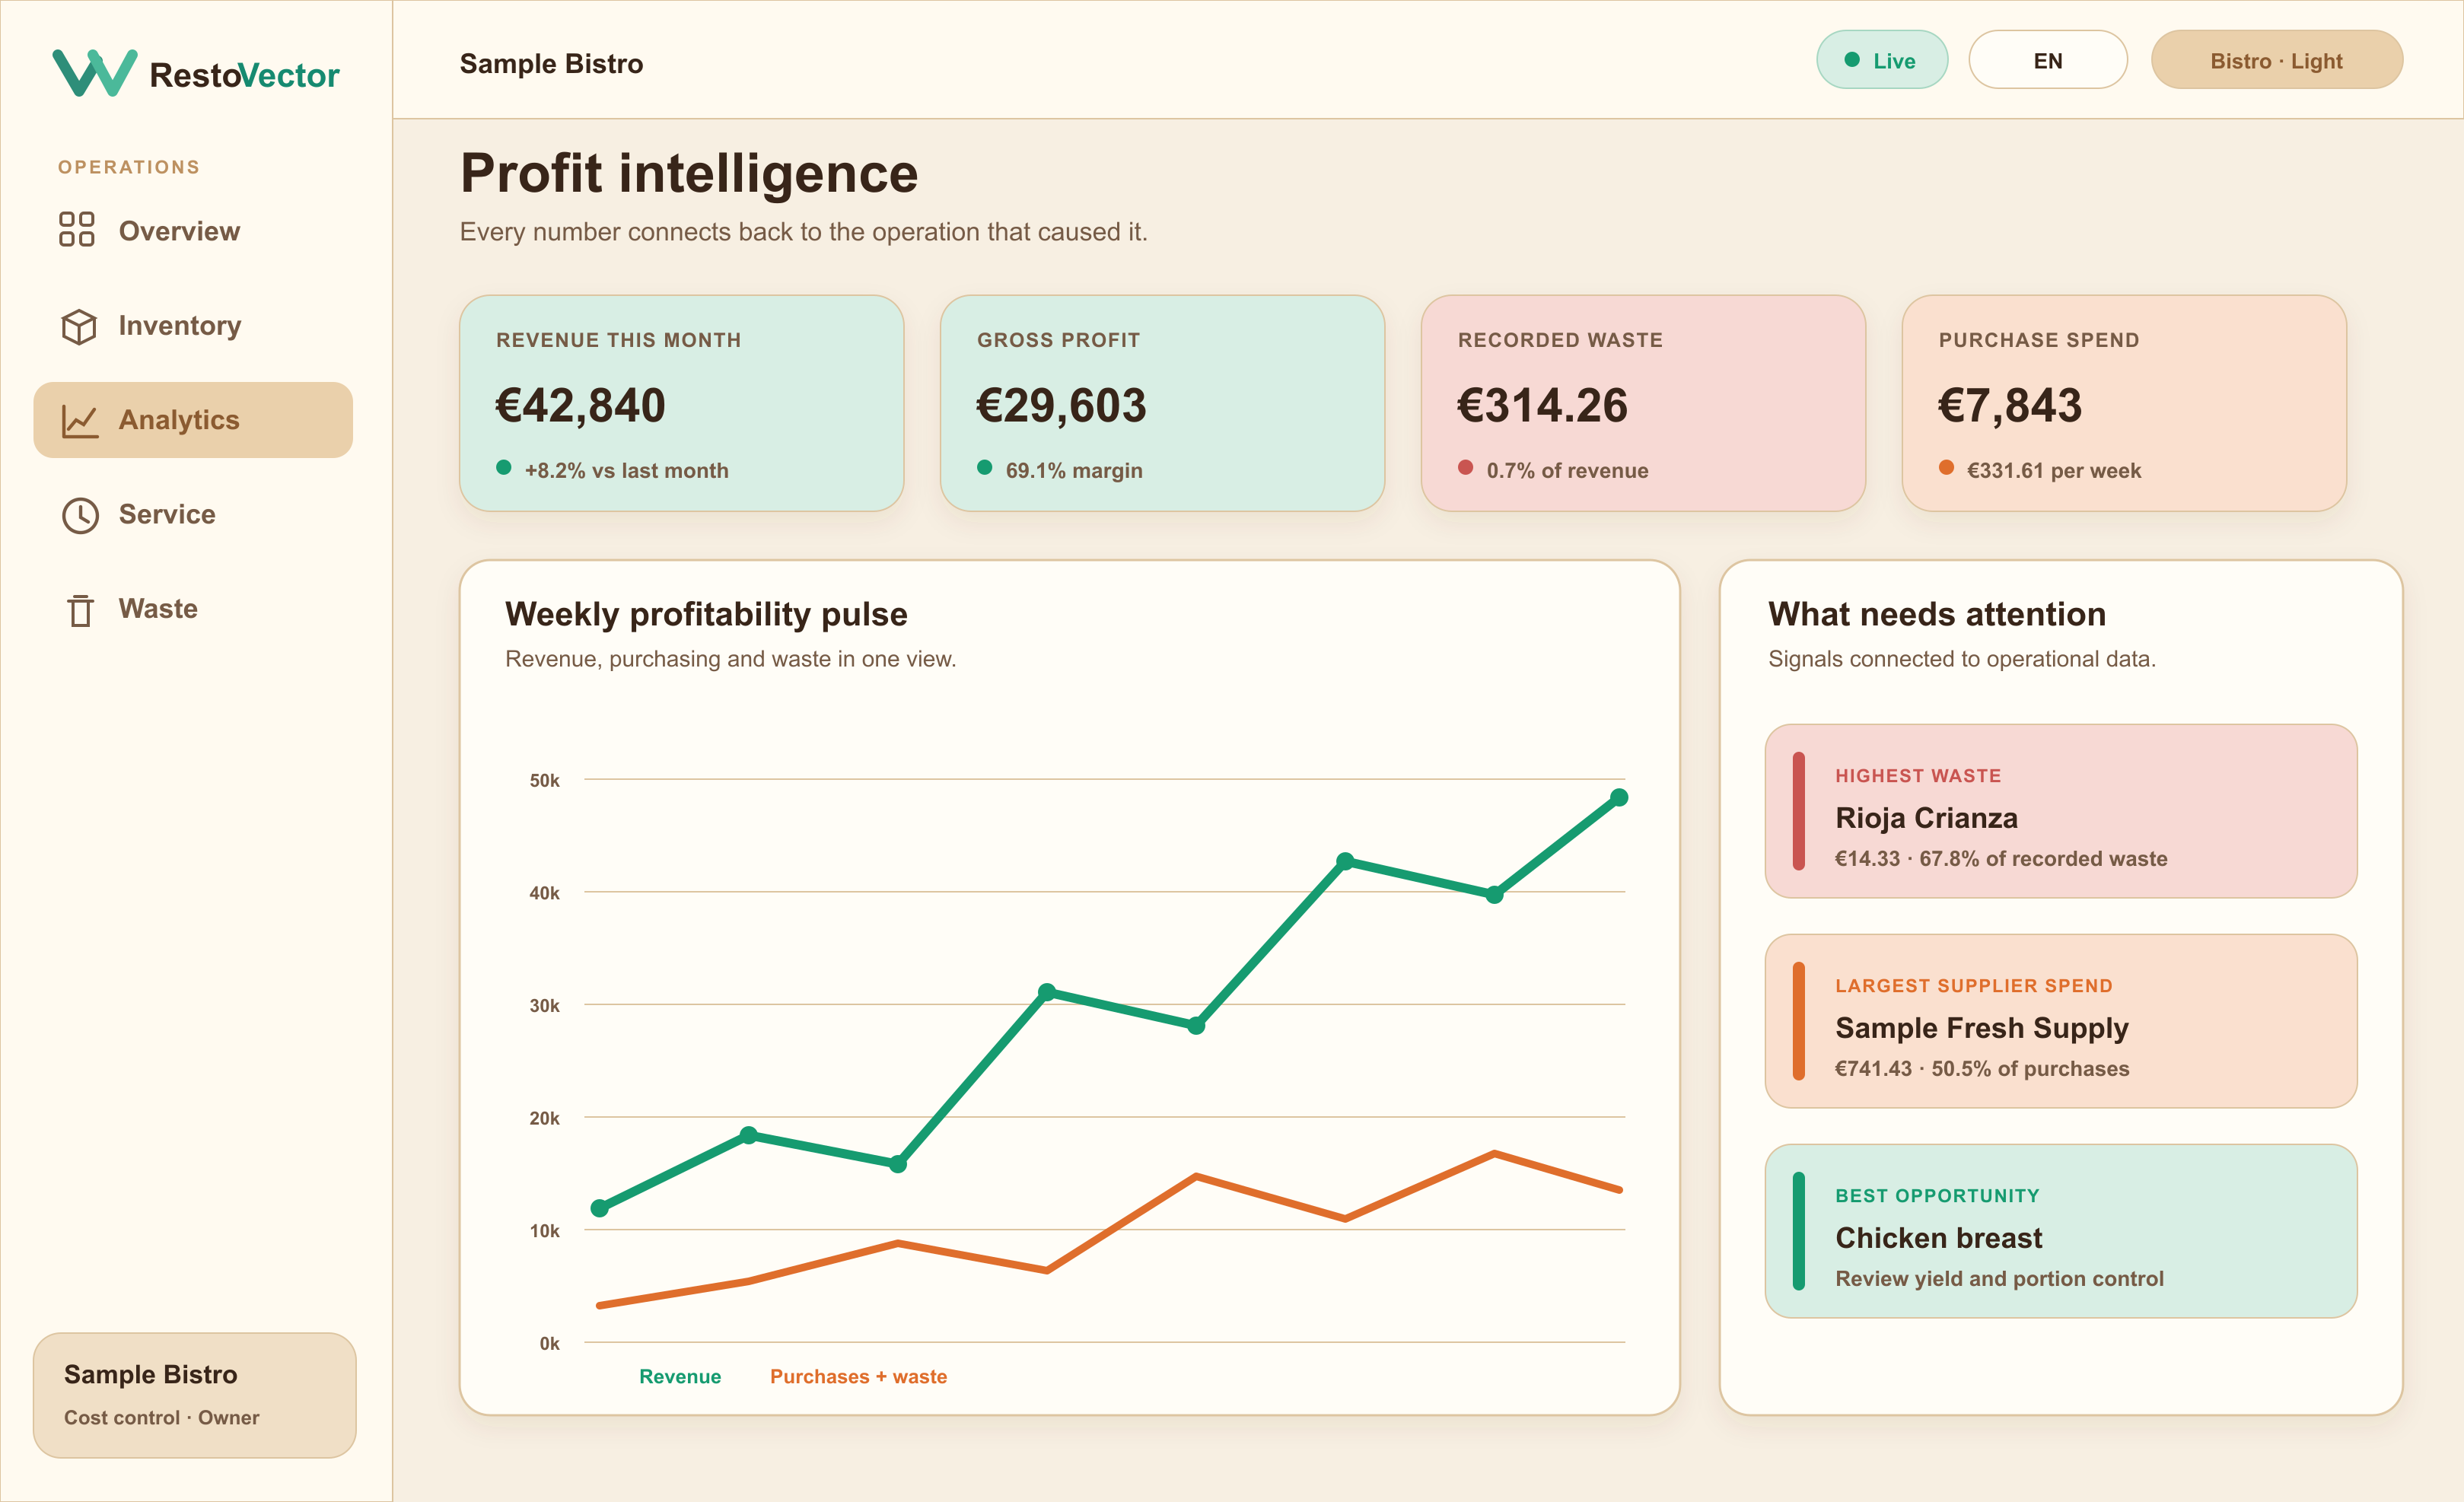
Profitability
Your real profit, explained
Sales, costs, margin and forecasts connected in one view that shows what is moving the result.
02 / 03
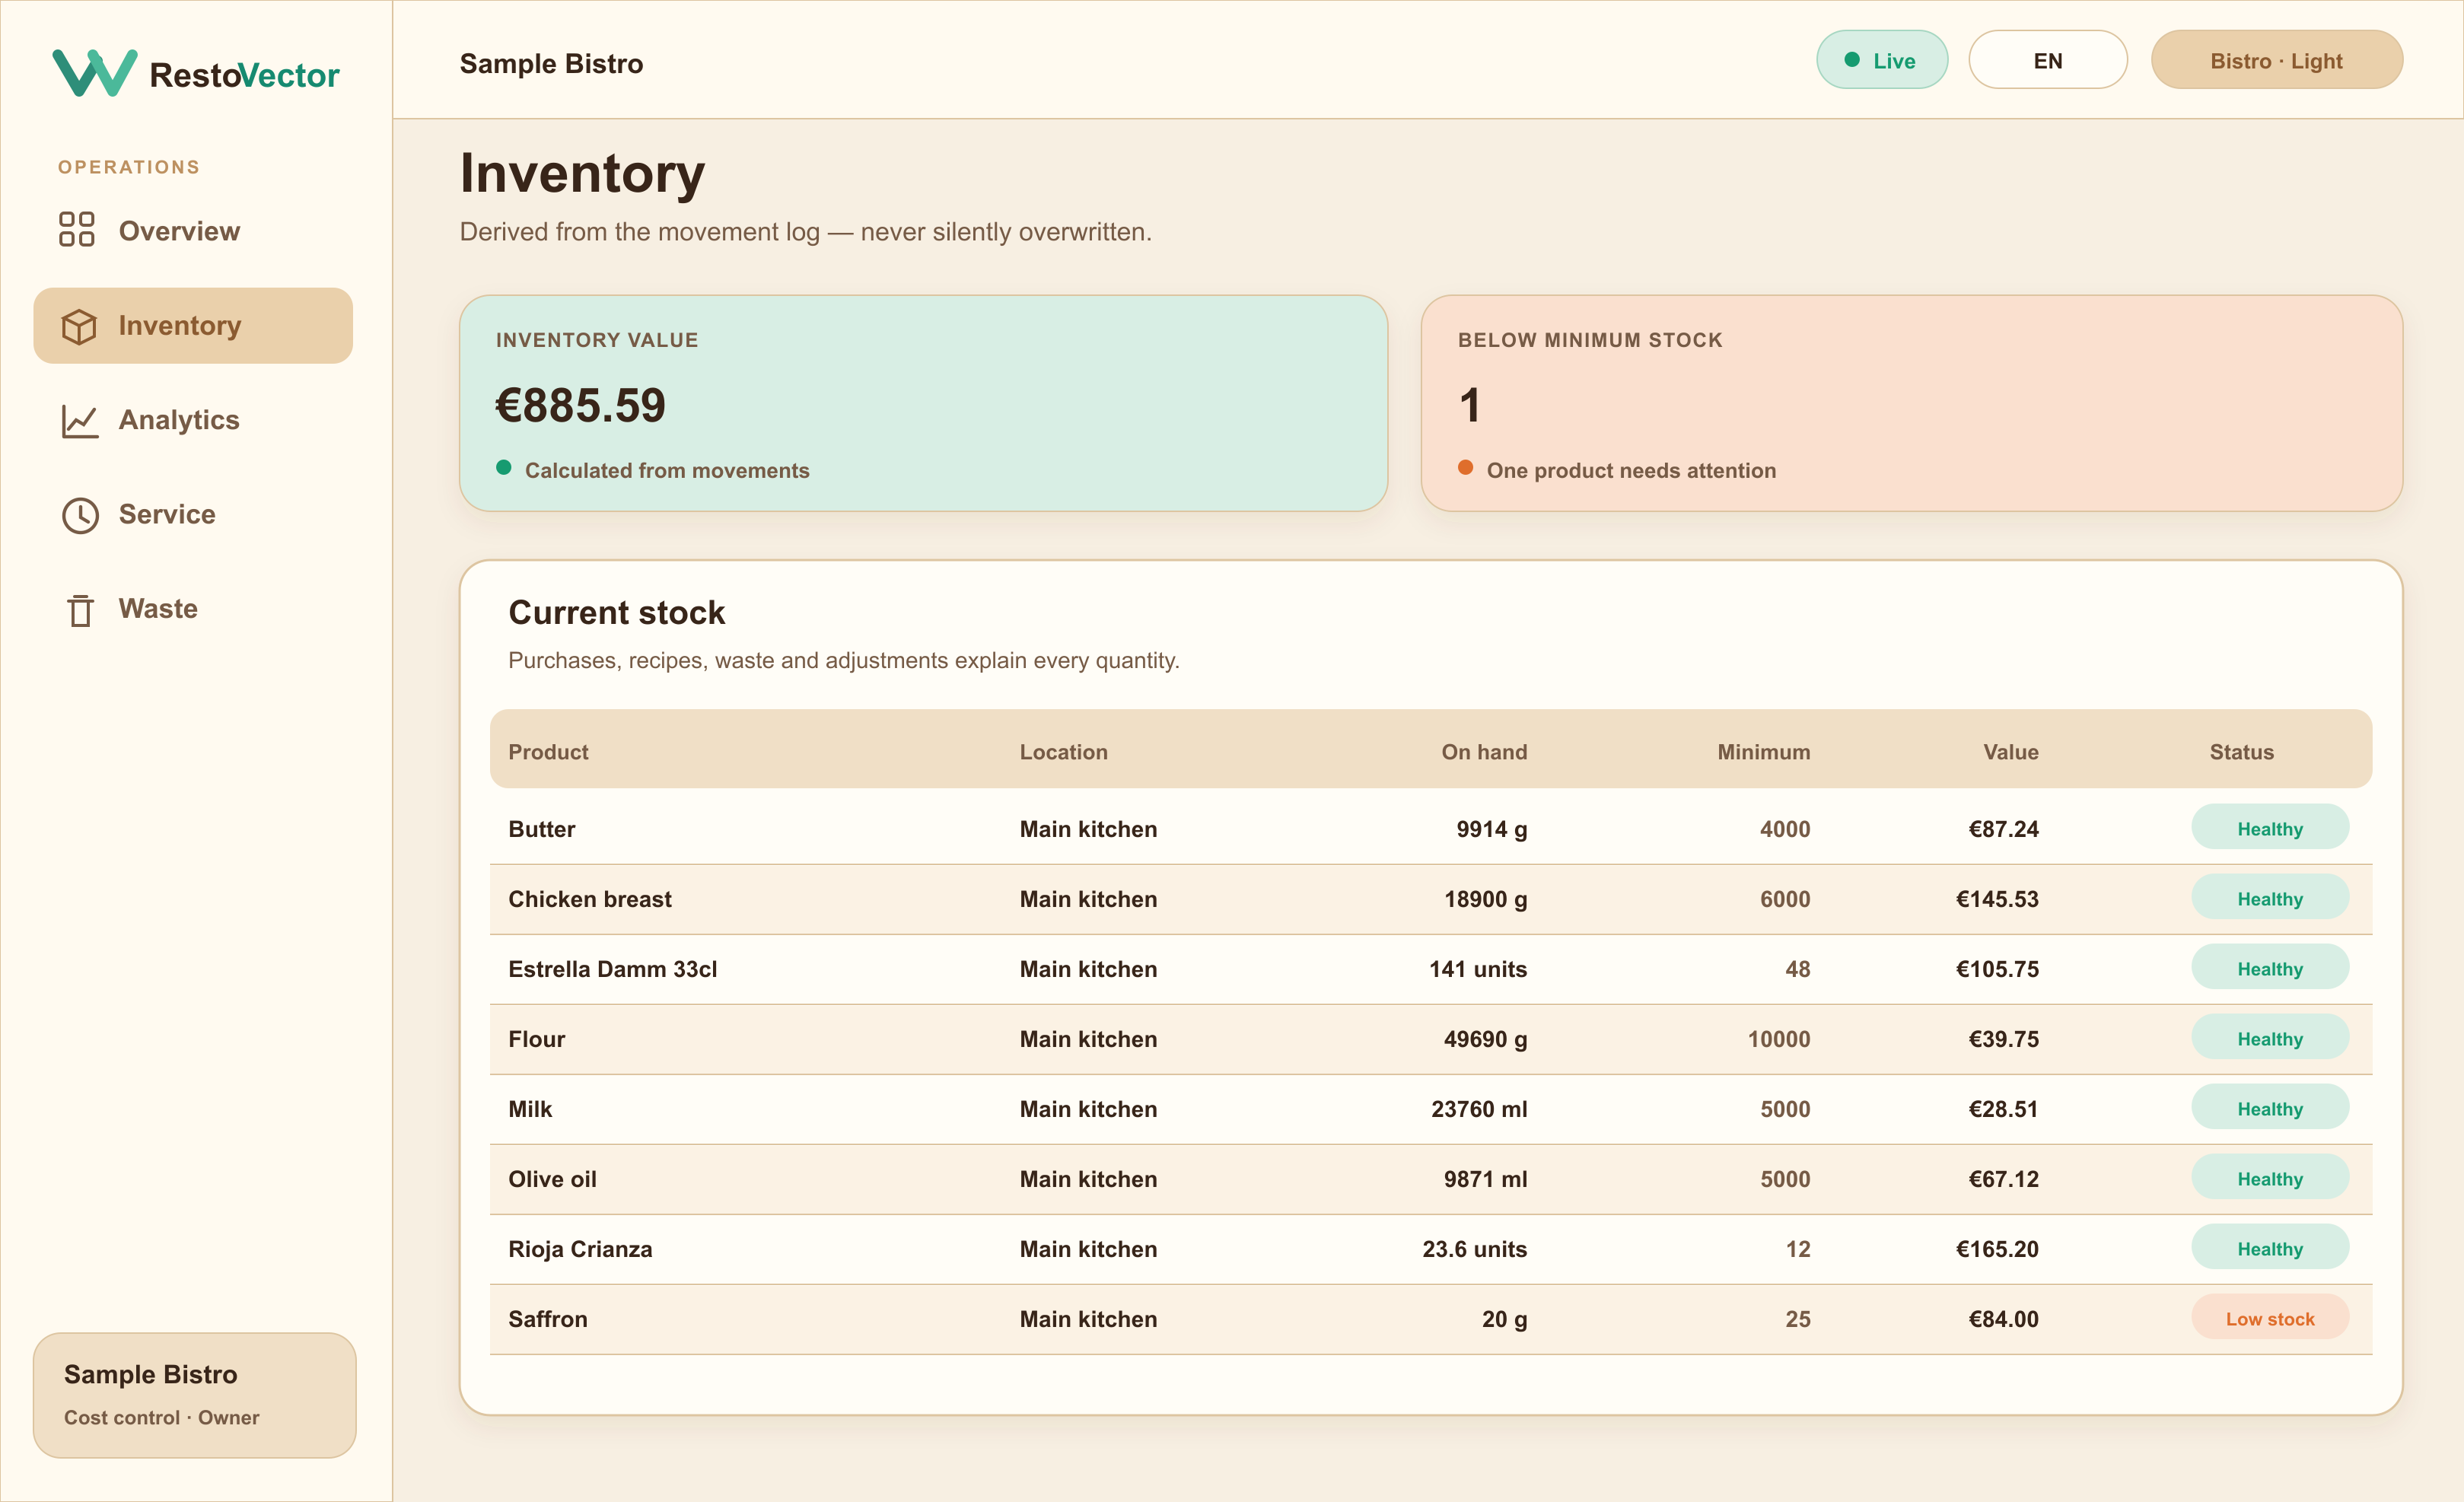
Inventory
Every movement leaves an explanation
Purchases, recipe usage, waste and adjustments explain stock and inventory value without silent corrections.
03 / 03
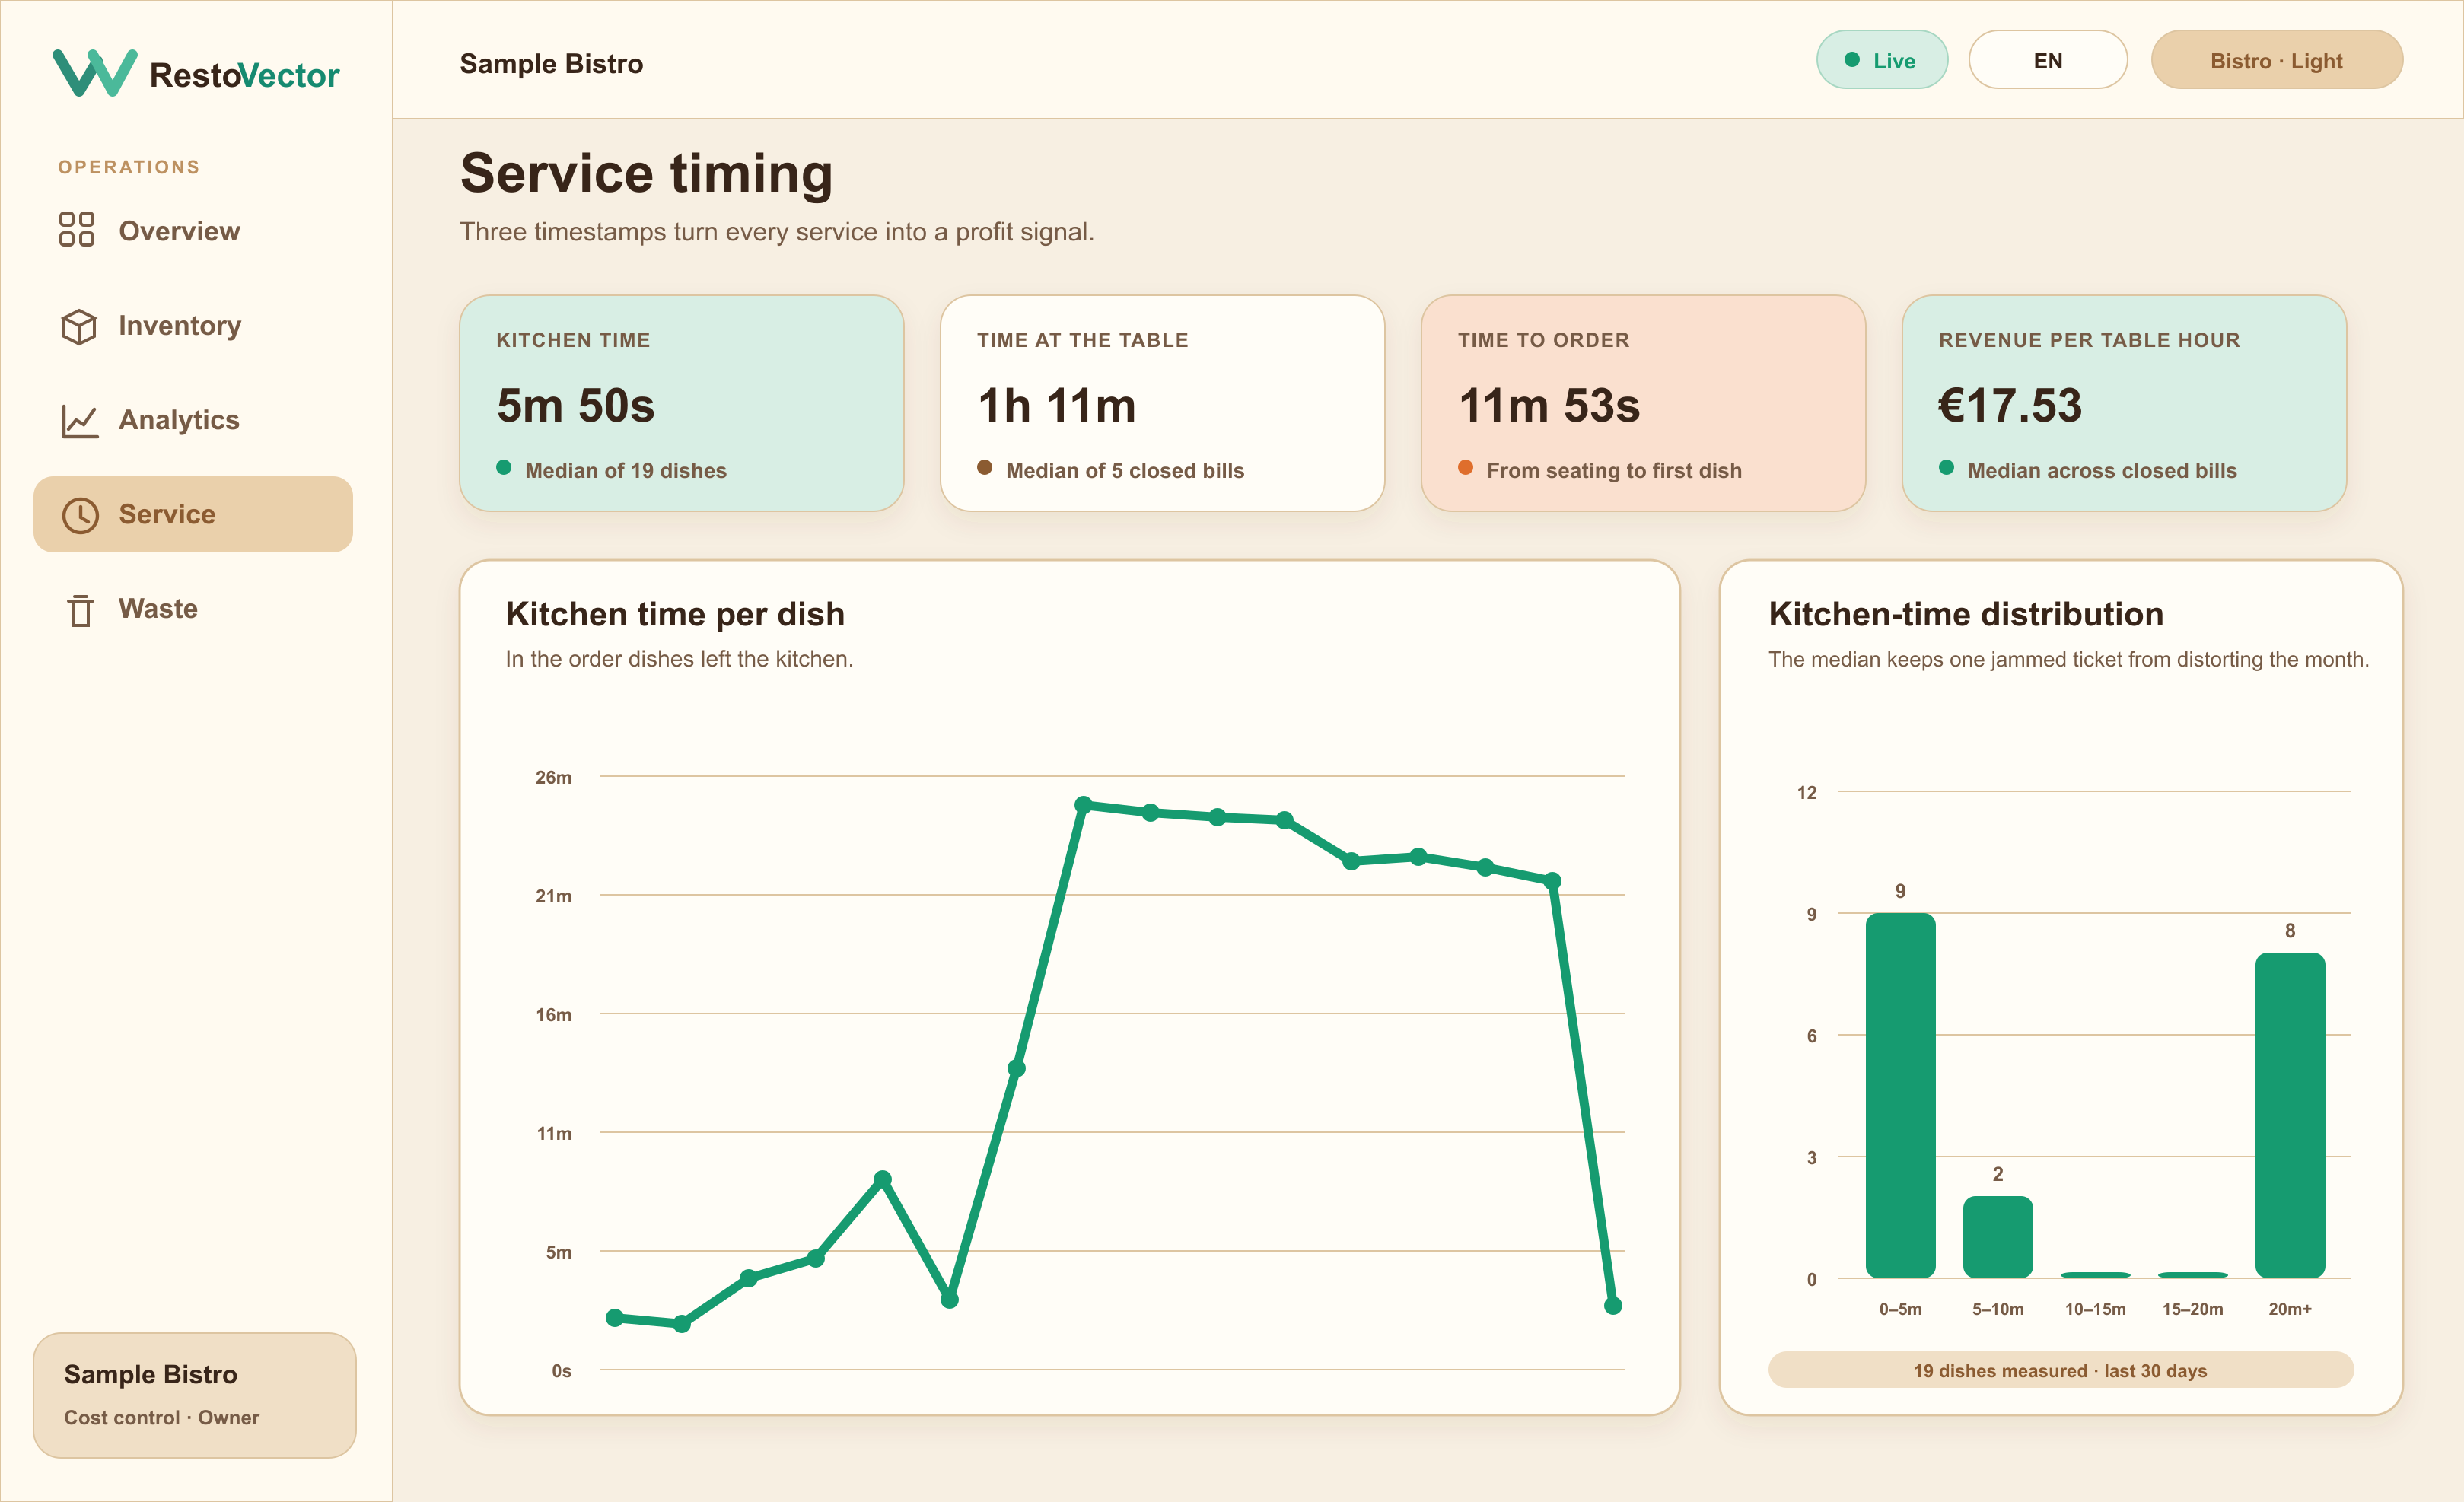
Service
The shift, measured as it happens
Orders, kitchen timing and service become operating signals, exposing bottlenecks before they damage margin.
01 / 03ProfitabilityActual product · Example data
02 / 03InventoryActual product · Example data
03 / 03ServiceActual product · Example data
↓Scroll to explore
Why costs are hard to spot
Small cost problems add up.
A supplier raises a price. Portions get slightly larger. Too much stock is ordered. Food gets wasted. Individually, these changes can be easy to miss. Together, they reduce margin.
Example restaurantPotential monthly impact
Chicken usage€428
Salmon overstock€391
Supplier price changes€316
Waste€194
Total potential impact€1,329/month
Cost control
See which problems are costing the most.
RestoVector helps management focus on the largest cost problems first instead of searching through several reports.
Salmon42 kgExpected: 21 kg/week21 kg/weekHigh stockReduce next purchaseEst. excess €311
Inventory
Keep stock under control.
See what is on hand, what was purchased and which products need attention. Recommendations are shown as estimates so management can review them before acting.
Waste
See where food waste is costing you.
Track what is being wasted, why it happened and how much it cost.
Waste this month€612Waste rate1.4%
Spoilage €281Preparation / trim €196Overproduction €135
Seafood waste+38% vs last monthPossible review: Ordering quantities
Example data
Suppliers
Notice supplier price changes early.
Keep a history of what you pay for important ingredients and see how price changes affect your costs.
RestoVector can also connect restaurant activity that affects inventory and cost. These tools help keep the operational records behind your cost reporting in one system.
01Service
Orders and table activity
02Kitchen
Preparation and order workflow
03Purchases
Supplier orders and receiving
04Recipes
Ingredient quantities and dish costs
05Locations
Track inventory across restaurant areas or sites
Owners and managers
Built around the information independent restaurant management actually needs.
For owners
See the financial picture without searching through separate reports.
✓ Food cost
✓ Waste
✓ Inventory value
✓ Supplier changes
✓ Cost issues
✓ Restaurant performance
For managers
See what needs attention and the records behind the change.
✓ Stock levels
✓ Purchases
✓ Waste
✓ Product usage
✓ Daily operational records
✓ Recommended reviews
Getting started
Start with the parts you need.
A restaurant does not need to configure every RestoVector feature on day one.
Better records make the cost analysis more useful over time.
Start with
Products
Suppliers
Purchases
Inventory
Waste
→Add as needed
Recipes
Dish costing
Kitchen workflow
Service
Additional reporting
Cost outlook
Understand where costs may be heading.
Forecasts are based on available restaurant records and should be treated as estimates, not guarantees.
RestoVector can model a range of possible outcomes using historical operating data.
Current food cost31.2%→Estimated next month32.4%
Primary factors
Supplier pricesHigh effect
WasteModerate effect
PurchasingModerate effect
Example data · Estimated outlook
Published in Restaurant Technology News
Can you trust your restaurant dashboard?
By Eduard Pàmpols, founder of RestoVector
Our founder shares three practical checks for evaluating restaurant software when an ingredient price, a waste entry or a stock count is missing. Learn what to ask in a demo before relying on the numbers.
RestoVector connects table orders, kitchen workflow, payments, inventory movements, purchasing, waste and profitability analytics so restaurant teams work from the same operational record.
How does inventory update after a sale?+
In Full Cost Control mode, sold dishes use their recipes to deduct ingredients and record food cost. Quick Start mode lets restaurants manage stock manually until recipes are ready.
Can owners manage more than one restaurant location?+
Yes. Owners can review permitted locations from one account, while staff access is limited by role and restaurant location.
Does RestoVector replace our payment provider?+
RestoVector records and coordinates the payment workflow. Each restaurant can connect supported payment and hardware providers as those integrations are configured.
Is RestoVector available in Spanish?+
Yes. The marketing website and restaurant application support English and Spanish, with a language preference for each user.
Request a demo
See where your restaurant is losing money.
Get a clearer view of food cost, inventory, waste, purchases and supplier pricing.